Bet Your Edge, Hedge the Rest: How Institutions Separate Skill From Luck
Move from retail to quant. Run the regressions. Check your VIF so you are not betting twice. Map your dimensionless loadings to real currency exposure. Respect the fact that edges decay. Bet your edge, and hedge the rest, knowing the difference between the two.
You trust your gut, you make a call, and it hits. For a moment you feel invincible. That feeling is the most expensive one in trading, because it cannot tell you the difference between a good decision and a rising market.
This post is about closing that gap. It is written for traders who already have a feel for the market and want to turn that feel into something systematic: a way to measure what you are actually doing. The institutional version of this skill has a one-line philosophy. Bet your edge, and hedge the rest. To do that, you first have to define, in numbers, what your edge even is.
The tailwind problem
Picture flying a plane with no instruments. You feel fast. The controls respond. You assume your piloting is doing the work. In reality a 200-mile-per-hour tailwind is carrying you, and the day it drops you find out how much of the speed was yours.
A trading record reads the same way. A great year in a bull market and a year of genuine stock-picking skill produce the same line on a P&L. Without a way to strip out the tailwind, you cannot say which one you had. You are making bets, but if you do not know your factor exposures, you are not making conscious bets. You are along for the ride. Winds can turn.
Even with factor invest portfolios, it's important to understand where the alpha comes from.
The fix is to build an instrument panel. In quant terms, that panel is a factor model. That can get validated.
What a factor actually is
A factor is an underlying driver of risk and return in the market. It is one of the hidden forces that moves many stocks at once: the broad market itself, company size, value, momentum, sector, interest-rate sensitivity, and so on. Most of any stock's daily move is not about that company. It is the factors pushing.
This is why the institutional goal is not "pick winners." It is to isolate idiosyncratic alpha: the slice of return that comes strictly from your specific view, after every shared driver has been removed. Bet your edge means to take risk on that idiosyncratic slice where you believe you know something. Hedge the rest means neutralize the factor exposures you are carrying accidentally, so a market swing or a size rotation does not decide your year for you.
You cannot hedge what you have not measured. So the rest of the work is measurement.
Where factors come from
Some factors are well known. Others have to be discovered, and discovery starts with heavy statistical lifting on large, often alternative, datasets.
A common tool is principal component analysis (PCA). Think of PCA as a sorting mechanism. Point it at thousands of stocks, and it groups them by how they move together, surfacing the variables that explain the most common variation. It can reveal a driver before anyone has a name for it.
Spotting a pattern is not an edge, though. A candidate factor has to survive three tests before it earns a place in a model:
Persistent. It shows up across time, not just in the sample window you happened to look at.
Robust. It holds across different geographies and asset classes, not only in the market where you found it.
Economically intuitive. There is a real reason it should pay. A factor with no economic story is usually a coincidence waiting to reverse.
A pattern that fails any of these is noise dressed up as signal.
Proving it pays: regression and R²
Once you have candidate factors, you test them with regression. A regression measures how well your factors explain returns. As you mix and match variables, the coefficients shift, but the number to watch is R²: how much of the return your model actually accounts for. R² is your measure of predictive power. A model that explains very little is not describing the market you trade.
Two terms get used loosely here, so it is worth keeping them apart.
A factor loading is a dimensionless number. It tells you how sensitive a stock is to a given factor, nothing more. Useful, but it does not pay the bills.
A factor exposure is that sensitivity mapped back to money. It is expressed in actual currency, based on the real cash positions in your book. Loadings tell you the shape of your risk. Exposures tell you how many dollars are riding on it. The translation from one to the other is where the math becomes a hedging decision.
Are you betting twice?
Here is a problem that catches people. Suppose you add several new factors to your model and R² barely moves. Have you learned anything, or have you just redescribed the same risk in new clothes? If two factors capture the same underlying bet, your model can quietly double your exposure to it while looking diversified.
The metric that flags this is the variance inflation factor (VIF). VIF measures how much of a new factor is already explained by the factors you hold. A signal that is mostly a repackaged version of an existing one shows a high VIF. Institutions set strict VIF thresholds for exactly this reason: to keep correlated, redundant variables out of the model, so each factor is carrying its own weight rather than echoing another.
The edge that bleeds out
Say you do all of it. The regressions hold, R² is solid, VIF is clean. You have found a real edge. Now comes the hard part, and it is the part a clean backtest hides.
Think of a crowded fishing spot. The historical data can prove, perfectly, that the fish were there yesterday. The crowd that read the same data guarantees they will not be there tomorrow. This is factor decay (also called alpha compression): as a factor becomes widely known and widely traded, the premium it paid gets competed away.
There is a bias baked into how factors are usually validated. Models are confirmed by looking in the rearview mirror, on historical data. That backward look can blind you to cyclicality and to a factor that is quietly dying.
The classic example is the size factor, the premium for holding small-cap stocks. For a long time it was treated as close to a sure thing. Then it underperformed for a brutal six-year stretch in the 1990s. The historical record that made it look certain is the same record that hid how cyclical it was.
So the discipline is not only to find factors. It is to keep asking whether the ones you hold are still alive.
What the research says: decay is real, but the process is rigorous
The size-factor story is not an anecdote. It is the normal life cycle of a factor, and recent quant literature treats it that way. Three working papers are worth reading if you want to see how institutions handle factors as assets that age. Each answers a different part of the problem, and none of them tries to beat the market.
Factors are assets that need re-rating
In Factor MAX and Predictable Factor Returns (2025), Liyao Wang and Ming Zeng start from a blunt premise: factors are no longer abstractions, they are products you hold.
"these factors have effectively become investment vehicles and asset classes in their own right. Their prominence highlights the importance of understanding not only average performance but also the extent to which factor returns are predictable."
Wang and Zeng (2025)
If a factor is an asset, its expected return drifts over time, and part of that drift is forecastable. Their signal, "factor MAX," sorts factors by their largest single-day return in the prior month. The spread is real and large:
"Factors with the highest maximum daily returns in the past month outperform those with the lowest maximum returns by 0.32% per month (t = 5.89)."
Wang and Zeng (2025)
The mechanism is behavioral, not magic. Investors pay limited attention to factor-level news and underreact to it. The takeaway for you is the re-evaluation discipline from earlier in this post, stated as a result: a factor's payoff is a moving target, so you monitor it, rank it, and re-rate it.
Skill has to survive a stability test, not just a backtest
Finding a profitable-looking factor is easy. Proving the profit was skill rather than a lucky stretch is the hard part, and it is the tailwind problem in formal clothes. In The Sharpe Stability Ratio: Temporal Consistency of Risk-Adjusted Performance (2026), Mario Bajo Traver and Alejandro Rodríguez Domínguez build a metric for exactly this.
"two strategies may display identical ex-post SR yet differ sharply in their temporal profiles, with one delivering stable performance across subperiods and the other concentrating gains in a few favourable episodes."
Bajo Traver and Rodríguez Domínguez (2026)
A high Sharpe ratio is not enough. The paper is explicit that even a strong probabilistic Sharpe ratio is not enough:
"statistically credible aggregate performance (PSR close to one) does not guarantee temporal consistency: high average SR may be generated by concentrated episodic strength rather than sustained skill."
Bajo Traver and Rodríguez Domínguez (2026)
The verification itself is rigorous, not hand-waved. The method treats the rolling Sharpe ratio as a time series, corrects for the serial correlation that overlapping windows create, and tests stability with block bootstrap procedures that "preserve the dependence structure of returns." That is what a real validation process looks like. It is the formal version of the three rules: persistent, robust, intuitive.
The system re-weights itself as factors cycle
Factors do not only decay, they cycle. In Dynamic Factor Allocation Leveraging Regime-Switching Signals (2024), Yizhan Shu and John M. Mulvey note that factor performance is "subject to strong cyclicality, with periods of persistent underperformance that can last for years." Rather than guess the turning points, their framework detects regimes and adjusts.
"These findings highlight the effectiveness of leveraging regime-switching signals to enhance factor allocation by capitalizing on factor cyclicality."
Shu and Mulvey (2024)
This is what sleeving looks like in practice. Each factor is a sleeve. A model identifies whether each sleeve sits in a bull or bear regime, then a Black-Litterman step re-weights the whole long-only portfolio toward the sleeves that are working. The factors get re-rated automatically based on performance, and the allocation adapts as conditions change. The result is concrete: the information ratio relative to the market rises "from just 0.05 for the EW benchmark to approximately 0.4."
The common thread: be probably profitable, do not time the market
Notice what none of these papers try to do. None of them forecast the index. None of them call tops or bottoms. None promise to beat the market on a given day.
What they share is a quieter goal. Build a system whose edge is verifiable, whose components are monitored and re-rated, and whose allocation adapts when conditions change, so that the odds of profit are tilted in your favor over time. That is the institutional posture. Not "I will beat the market this quarter," but "I have a process that is quantitatively likely to pay, and that corrects itself when a factor ages out."
The honest limit
A fair objection sits underneath all of this. If factor models are validated on historical data, and the next crisis is by definition something the data has never seen, can a purely mathematical approach protect your capital from a shock that has not happened yet?
The honest answer is not fully. A factor model is an instrument panel, not a crystal ball. It will not tell you what tomorrow's unprecedented event looks like. What it does is far more modest and far more useful than the gut it replaces. It tells you, right now, which of your bets are conscious and which are accidental, how many dollars each one is risking, and whether two of them are secretly the same bet. It turns flying blind into flying with instruments. The weather can still surprise you. You are no longer pretending the tailwind is skill.
Math is not the enemy
If you are coming from retail, the wall of notation in those papers can read as a closed door. It is not. The fear of the math is the real barrier here, and it is worth taking apart, because almost none of this asks you to be a human calculator.
Here is the honest division of labor. You do not need to derive a HAC standard error by hand. You need to know what it is for, when it applies, and roughly what a wrong answer would look like. The machine computes. You judge. That second job is the one that pays, and it is the one no tool does for you.
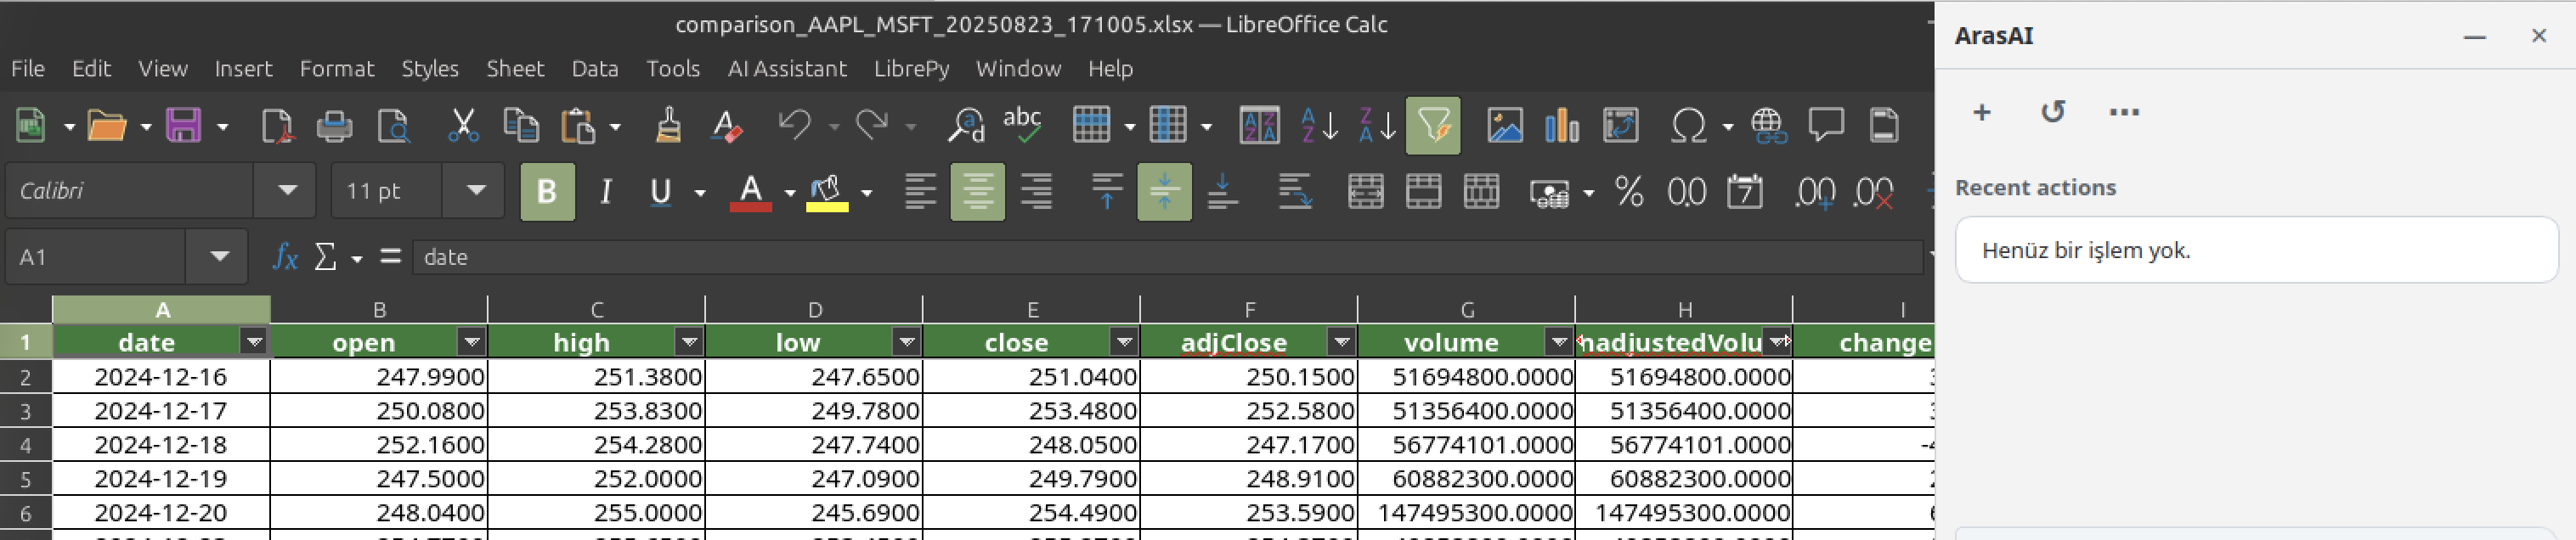
LibreOffice Calc has LibePy and ArasAI, which can be helpful as well. It loads faster than Excel and has similar functions. The AI support is in its infancy.
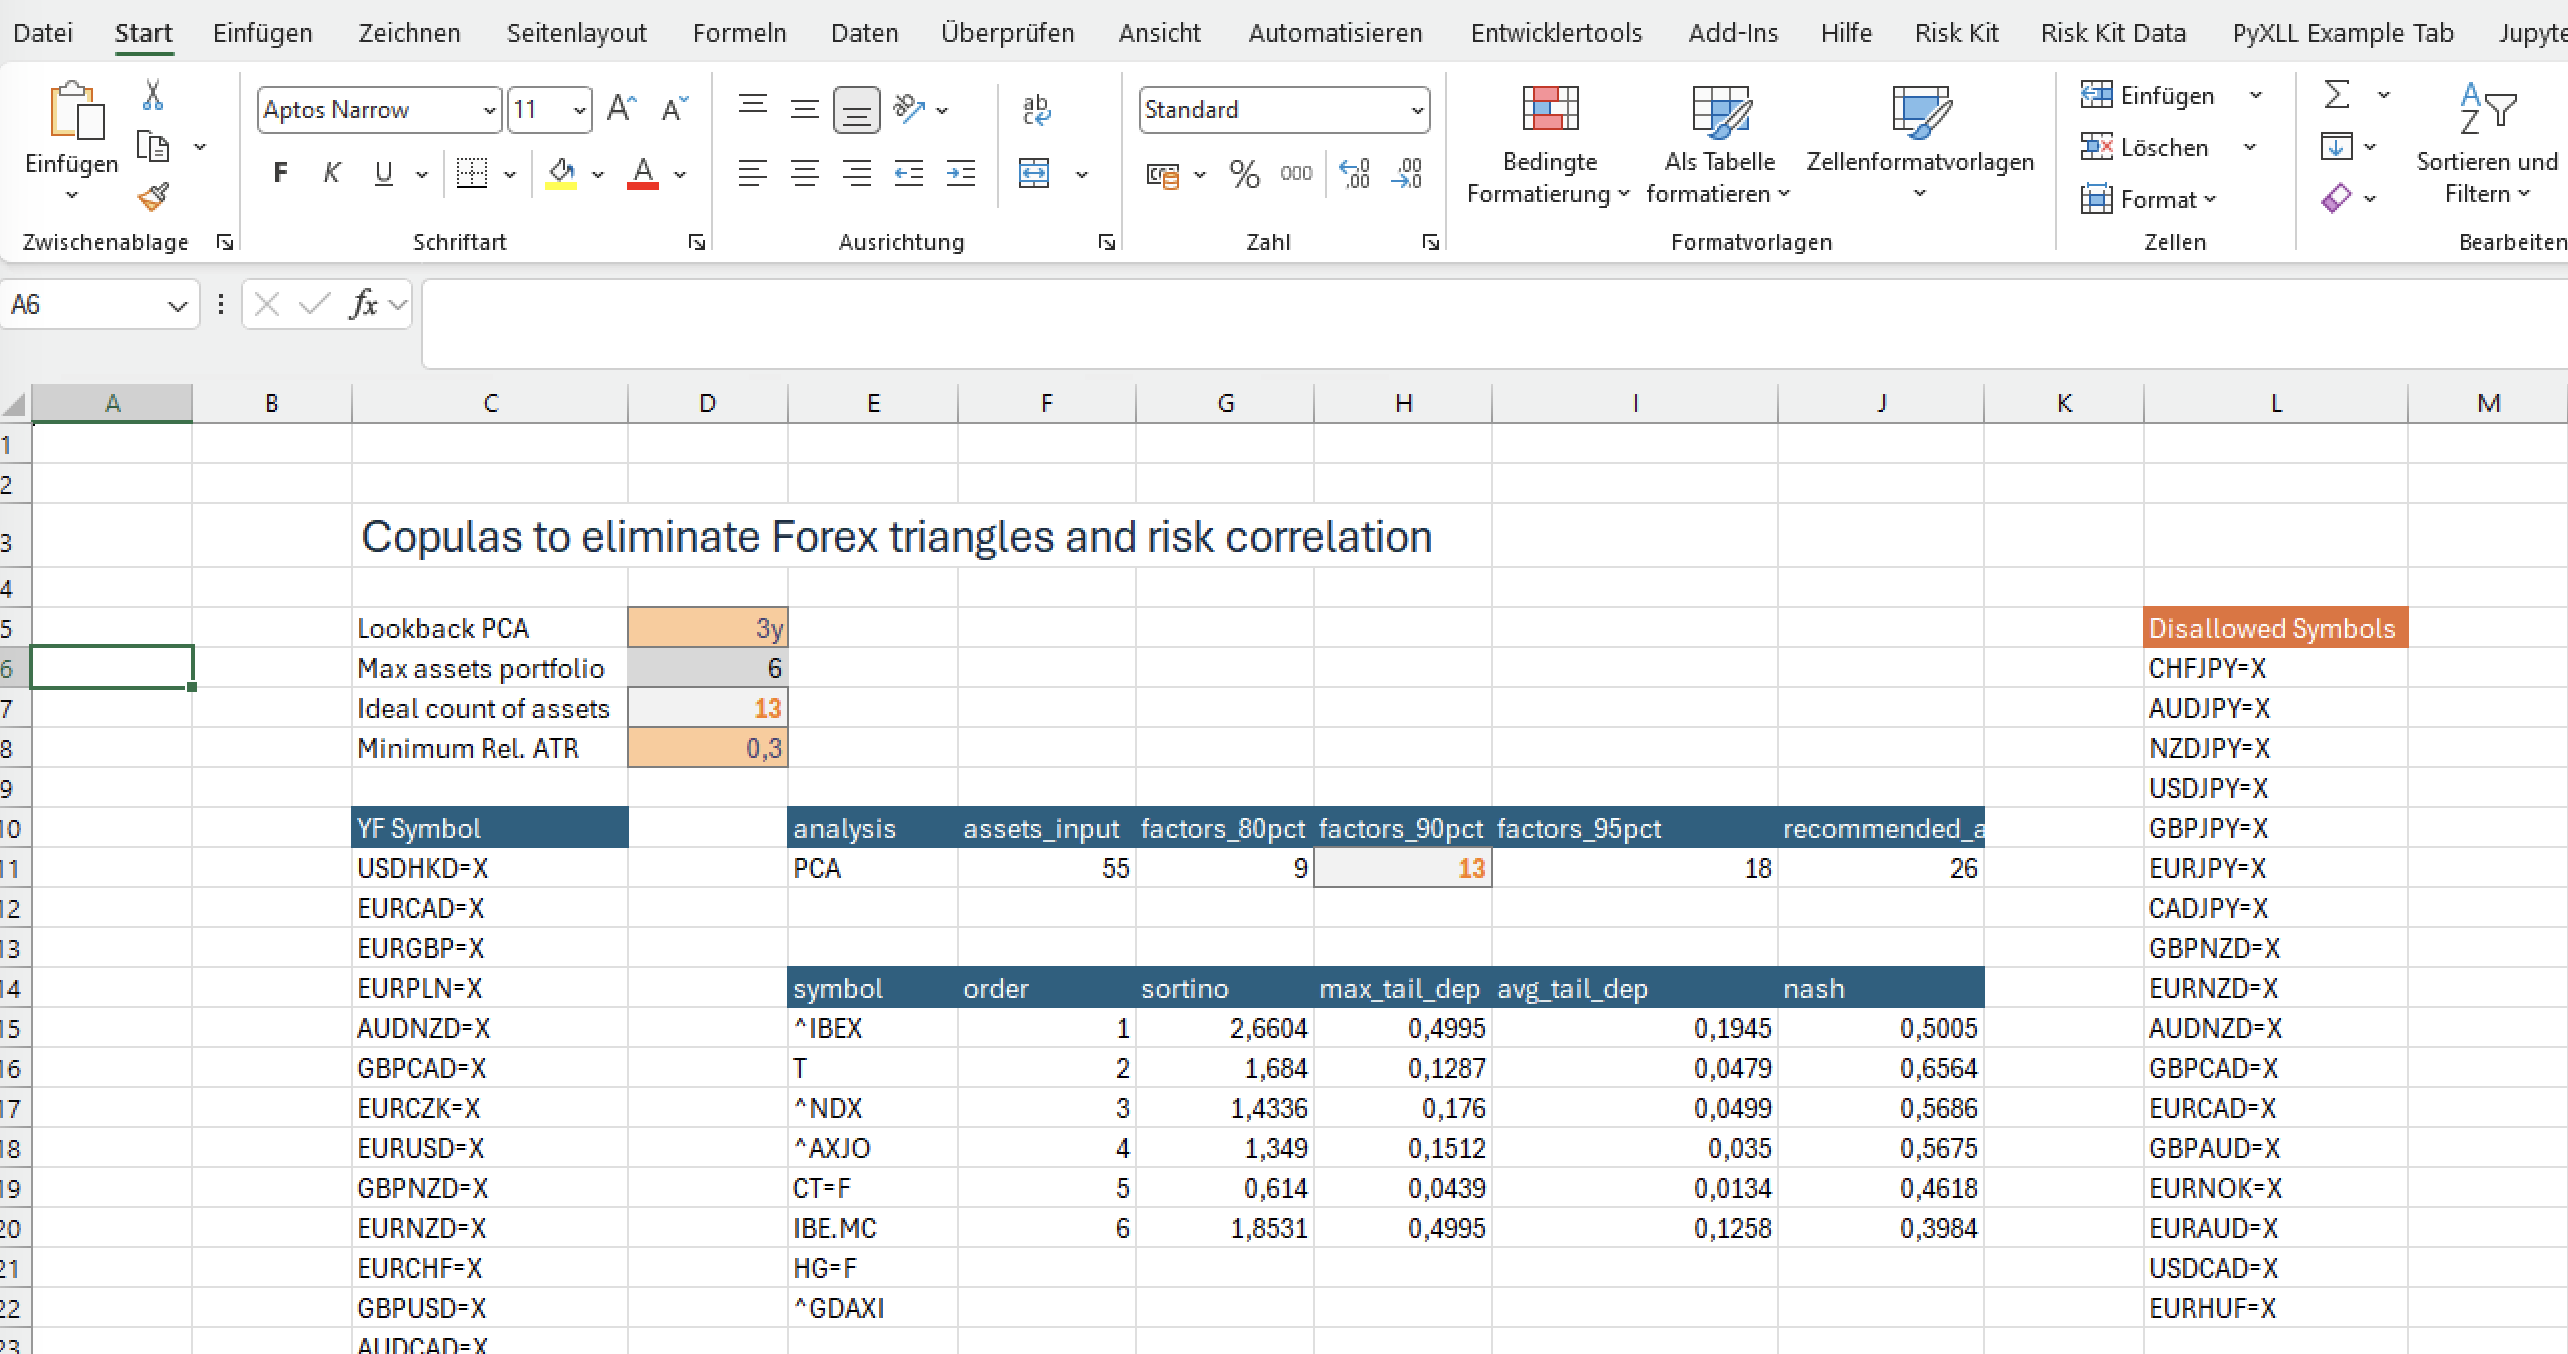
Will you need Excel? Or Calc? Not in addition to Python, but you will need to check the calculations, and Excel is where quants have always done that checking. It is a turning point: the place where a model stops being a slide and becomes numbers you can poke at, cell by cell. A regression coefficient, a rolling Sharpe ratio, a VIF, all of it can be laid out and audited in a spreadsheet before you trust a line of production code.
Excel is the standard in finance. On Windows.
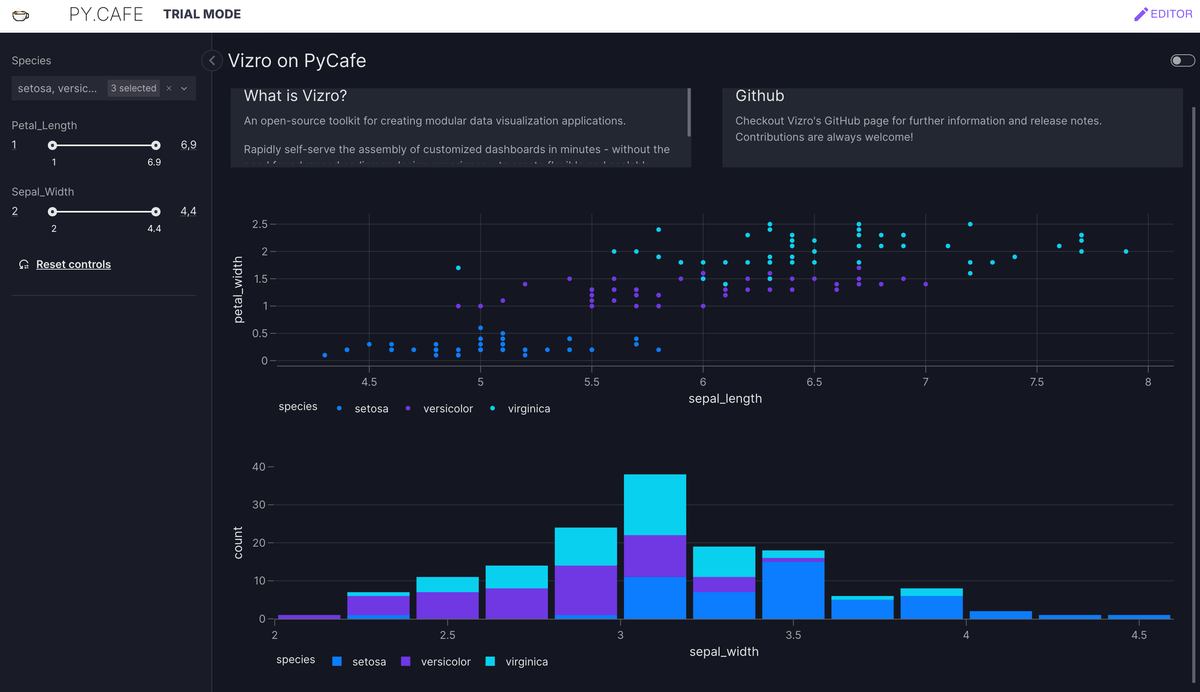
On a technical note: yes, AI agents can do data visualization. But not the sophisticated disciplined step-by-step work.
This is also where modern AI agents change the entry path. An agent can now drive Excel for you: build the sheet, run the regression, compute the stability metric, lay out the factor sleeves. That lowers the barrier into applied quantitative finance more than anything before it. You can get hands-on with real calculations far earlier than the old curriculum allowed.
The catch is the same as everywhere else in this post. An agent hands you an answer whether or not the answer is right. You still need enough experience to validate the output: to notice that a t-stat is implausibly large, that a coefficient flipped sign, that the rolling window is too short to mean anything. The agent does the labor. You supply the judgment that says "that number is wrong." Build that judgment and the math stops being a gate. It becomes the instrument panel.
Two Excel agents that can do this work are worth a look:
It is tempting to assume the next agent will simply discover the factors for you and make everything above unnecessary. It will not, at least not yet. As of today, no one is making money at scale on factors that an AI found and validated on its own. Those factors do not really exist in production books (Reference: Quantopian 2026).
The reason matters for where you spend your effort. AI compresses the grind, copy paste, CSV here JSON there, workflows. It does not replace the rigour of validation, the craft of quant work, or the judgment behind a finance decision. Those are still yours to own, and they are exactly what this post has been about.
That is the move from retail to quant. Run the regressions. Check your VIF so you are not betting twice. Map your dimensionless loadings to real currency exposure. Respect the fact that edges decay. Bet your edge, and hedge the rest, knowing the difference between the two.
Shu, Yizhan, and John M. Mulvey. "Dynamic Factor Allocation Leveraging Regime-Switching Signals." Working paper, October 2024. arXiv:2410.14841 [q-fin.PM]. https://arxiv.org/abs/2410.14841
The link has been copied!
Your link has expired. Please request a new one.
Your link has expired. Please request a new one.
Your link has expired. Please request a new one.
Great! You've successfully signed up.
Great! You've successfully signed up.
Welcome back! You've successfully signed in.
Success! You now have access to additional content.